
Analytics
The Ecommerce Analytics page gives you a live view of your sales performance — revenue, margins, best sellers, and stock alerts.
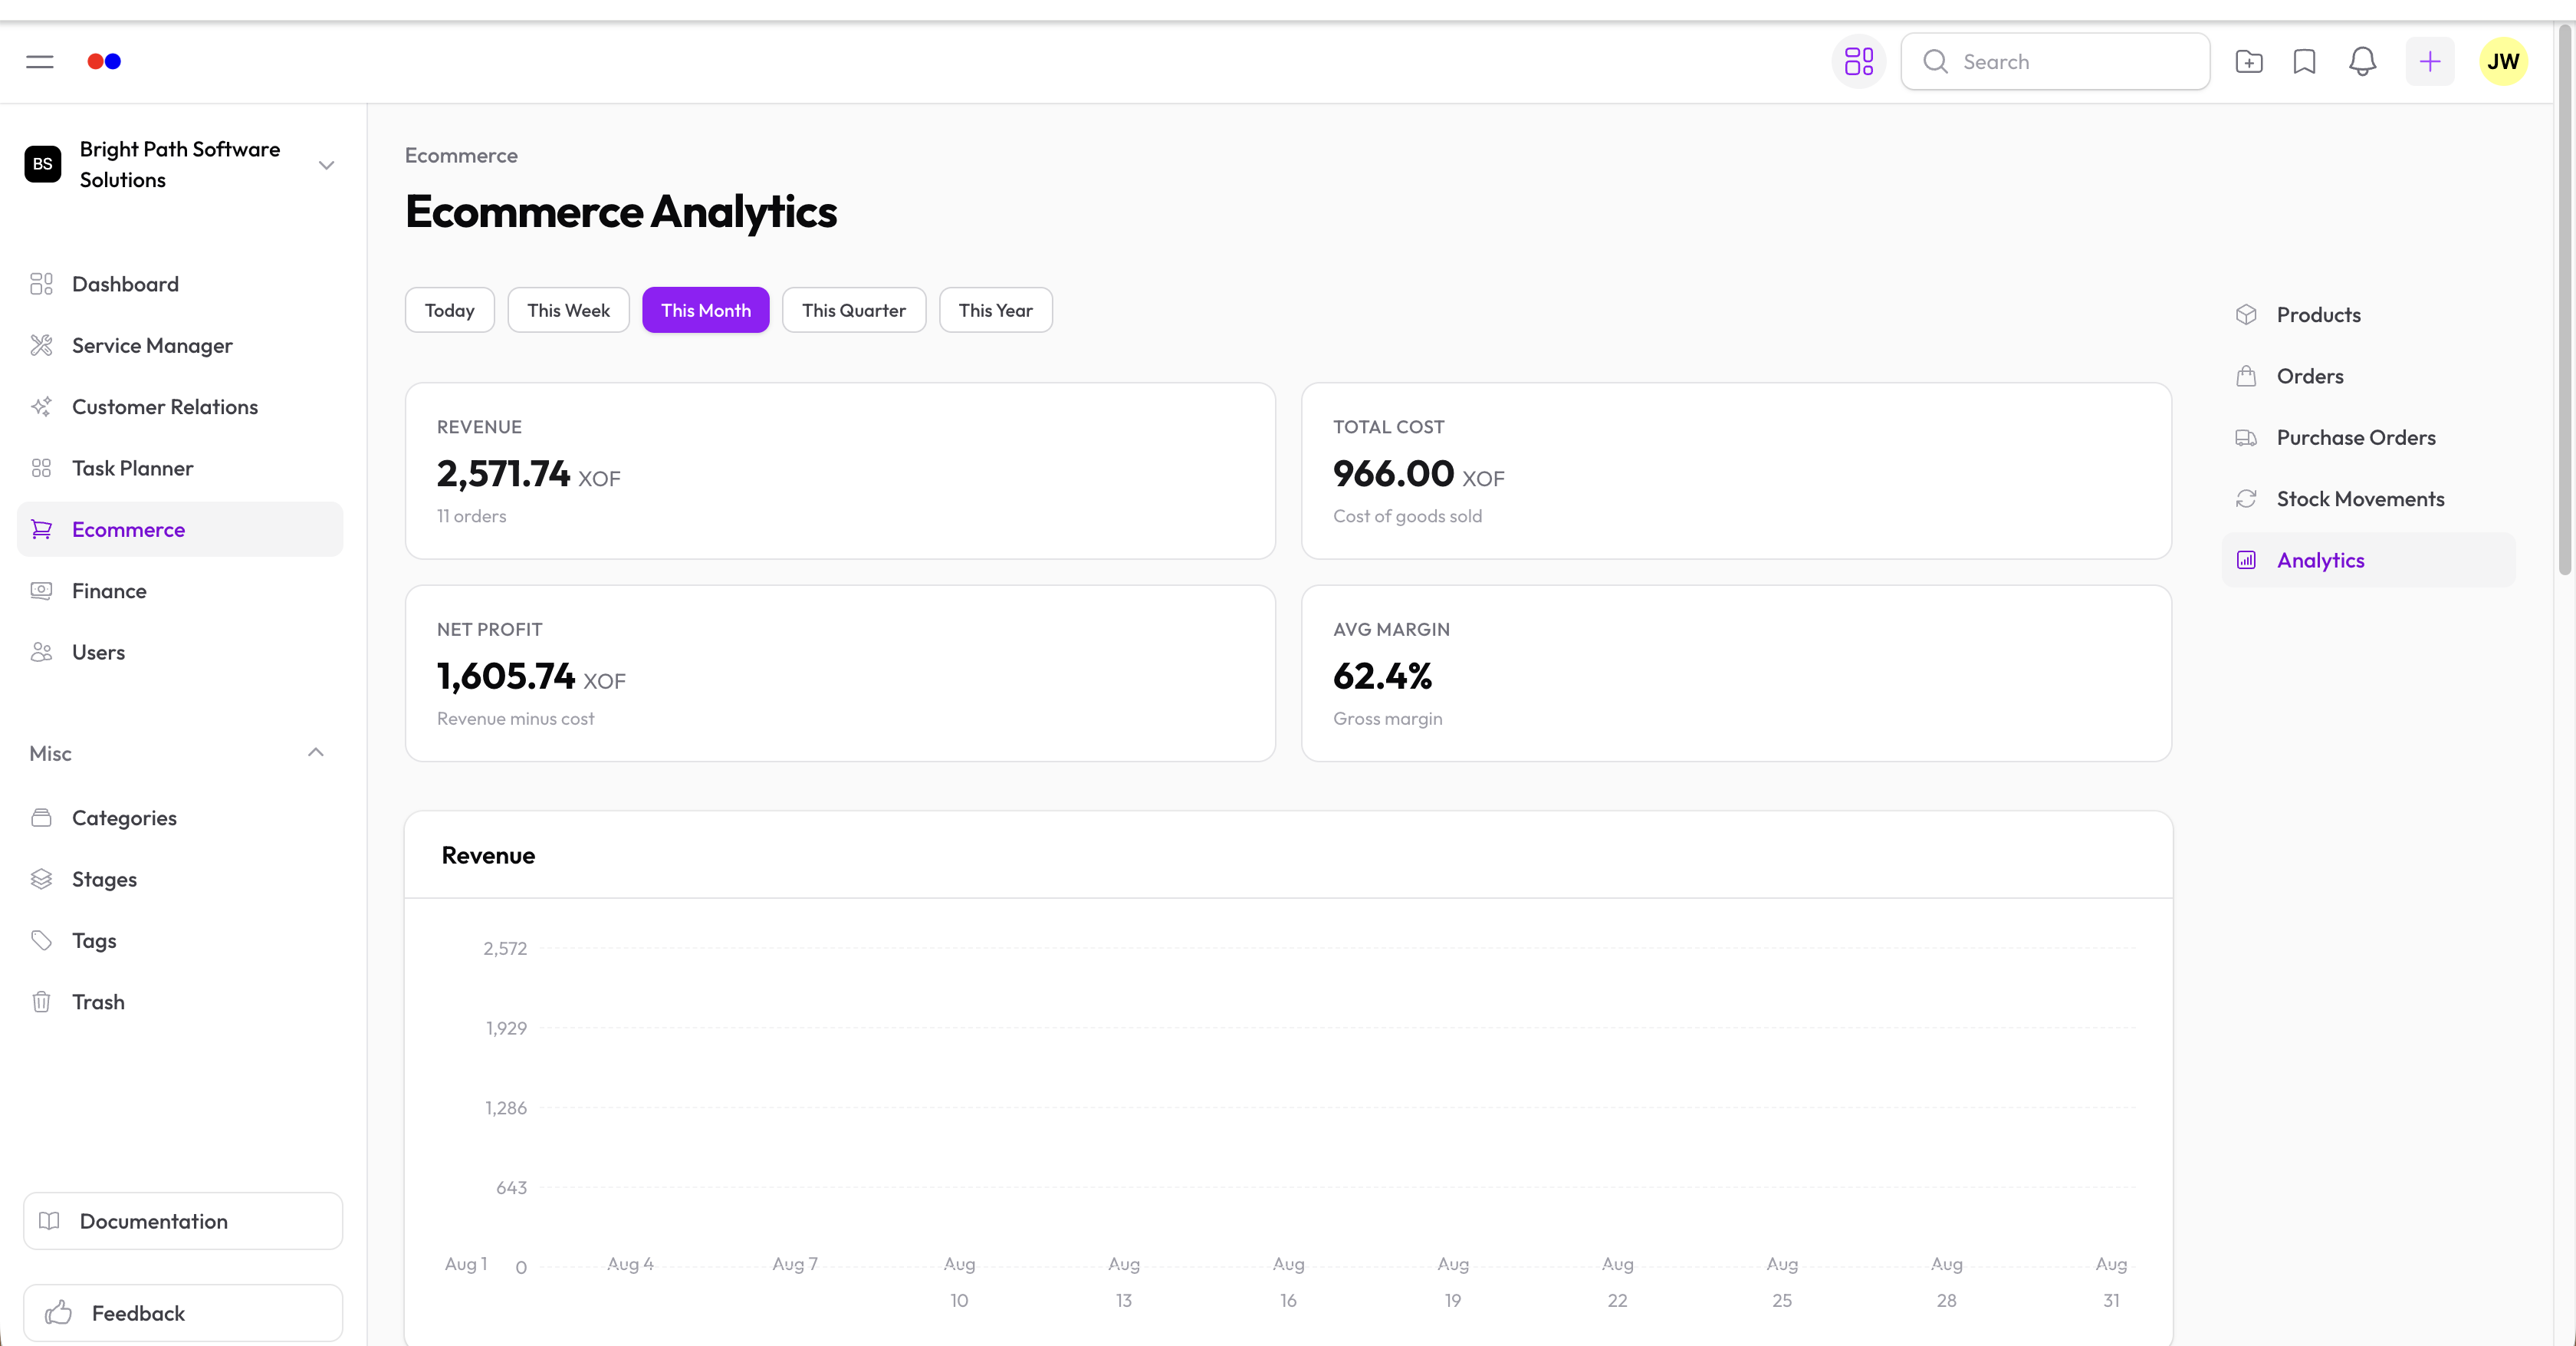
Metrics
| Metric | Description |
|---|---|
| Revenue | Total sales value for the selected period |
| Cost | Total cost of goods sold |
| Gross Margin | Revenue minus cost, as a percentage |
| Daily Revenue | Bar chart of revenue by day |
| Best Sellers | Products ranked by units sold or revenue |
| Low Stock | Variants at or below their reorder point |
Period Selector
Use the period selector at the top of the page to switch between Today, This Week, and This Month. All metrics update to reflect the chosen window.
Low Stock Alerts
The Low Stock widget lists every variant whose current stock quantity is at or below its configured reorder point. Set reorder points on your product variants so this widget gives you early warning before you run out.